There are several different types of data which are observed and collected non-stop at Metsähovi Radio Observatory. The data sources vary; for example, there are two weather stations in Metsähovi, a spectrum analyzer to measure radio interference, the EFOS-9 hydrogen maser which is the frequency reference of the observatory and an ADAM/NuDAM control/monitor network which is used amongst other things to observe the state of astronomical receivers and to collect the data from two meter solar radiometer.
Most often the purpose of the data is to aid the observations and to help the maintenance and upgrading of the instruments. So there is a demand to view the data graphically, monitored values versus time. For that reason two CGI programs have been developed. These are ``MB'' and ``Latest'', both written in Perl programming language. They are available at the site ``http://kurp.hut.fi/local/'' which initially limits the access to the computers on-site at Metsähovi.
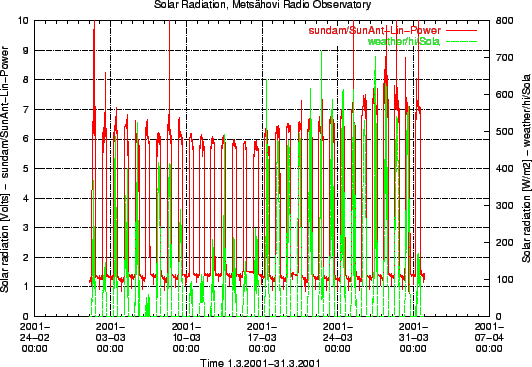
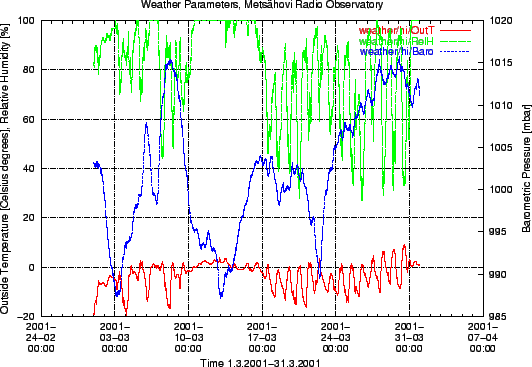
The ``Multi-browsing'' program ``MB'' allows user to freely choose data types, parameters, a time period, and presentation of data. The results of an inquiry are plotted to files both in Postscript and GIF formats and shown on the browser.
 |
 |
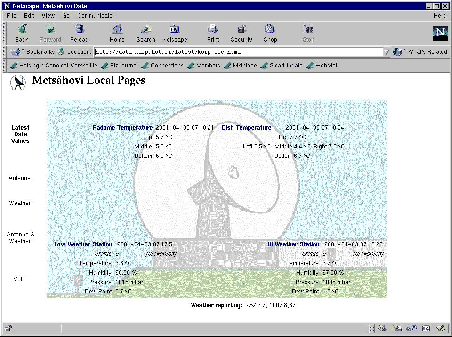
The ``Latest'' script inserts the latest monitored values into template HTML text. One can also format the output of the data. The script has been used for example to make an HTML page for observers. The automatically updating page shows the latest weather and antenna temperature values printed on the visualizing picture of the observatory.
The flexibility of the programs results from the feature that they automatically make new data types available if only the data is archived into the ``data'' machine and a ``mb_txt'' file describing the data parameters exists in the same directory where the data files are.