


Next: Solar Data Analysis
Up: Solar Research
Previous: Solar Research
Contents
Project Team: Urpo
Solar observations continued at Metsähovi in 2000. Receivers working
at 37 GHz and 87 GHz were used. Number of observing days was 43. More
than 100 solar radiation maps were measured and active regions were
tracked for about 100 hours in order to detect energy burst and releases
at radio waves. Only few events were detected. Analysis of measured
data continued in international cooperation.
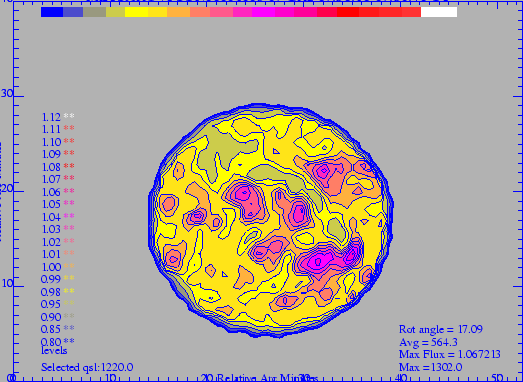
Figure 20:
Solar map measured at Metsähovi on August 18, 2000.
Frequency was 87 GHz (wavelength 3 mm). North is on top. Several
active regions can be seen (red coloured areas) and a prominent
coronal hole extends from the solar limb to the equator (green
coloured structure).
 |
Ari Mujunen
2001-07-30